Free Rental Property Calculator · No sign-up

Analyze a Rental Property Before You Invest

Enter a deal and see its cap rate, cash flow, cash-on-cash return and DSCR instantly. Then save it to Fox AssetPro for the full 10-year analysis.

Purchase & financing
Income
Expenses
Other expenses: repairs, utilities you pay, trash, landscaping.
When you save this deal
  • 10-year pro forma Rent, expenses and cash flow year by year, with growth built in
  • Sale & exit Net proceeds and IRR if you sell in any year, 1 through 10
  • Break-even The price and interest rate where the deal stops cash flowing
  • Portfolio fit What it does to your total cash flow, units and LTV
Example: a $450,000 two-flat. Replace it with your deal.
Monthly cash flow
—
Cap rate—
Cash-on-cash—
NOI—
DSCR—
Mortgage—
Cash to close—
When you save this deal
  • 10-year pro forma Rent, expenses and cash flow year by year, with growth built in
  • Sale & exit Net proceeds and IRR if you sell in any year, 1 through 10
  • Break-even The price and interest rate where the deal stops cash flowing
  • Portfolio fit What it does to your total cash flow, units and LTV
Save this deal — Get 90 Days Free →
Opens with your numbers filled in · No credit card
Acquisition Inputs

Know the numbers before you make the offer.

Every rental property investment starts with a set of assumptions—purchase price, down payment, loan terms, expected rents, vacancy, operating expenses and growth rates. Fox AssetPro's Deal Analyzer gives you a structured place to enter all of them and instantly see what the numbers say. You do not need to build a spreadsheet from scratch or wonder whether you forgot a line item. The analyzer walks you through acquisition costs, financing structure, unit-level rent rolls and operating expenses so that every variable that drives returns is accounted for.

Once your inputs are in, Fox calculates the metrics that experienced investors rely on: Net Operating Income (NOI), Cap Rate, Cash-on-Cash Return, Debt Service Coverage Ratio (DSCR), monthly and annual Cash Flow, and Internal Rate of Return (IRR). Every metric is calculated directly from the acquisition price, financing terms, income and expenses you enter, projected forward with the growth assumptions you choose. You can see how the math works, and adjust any input to see how the results change.

The goal is to give you confidence before you make an offer. Instead of relying on a broker's pro forma or back-of-the-envelope math, you build your own analysis with your own assumptions and your own financing terms. If the numbers work, you move forward with conviction. If they do not, you save yourself from a costly mistake.
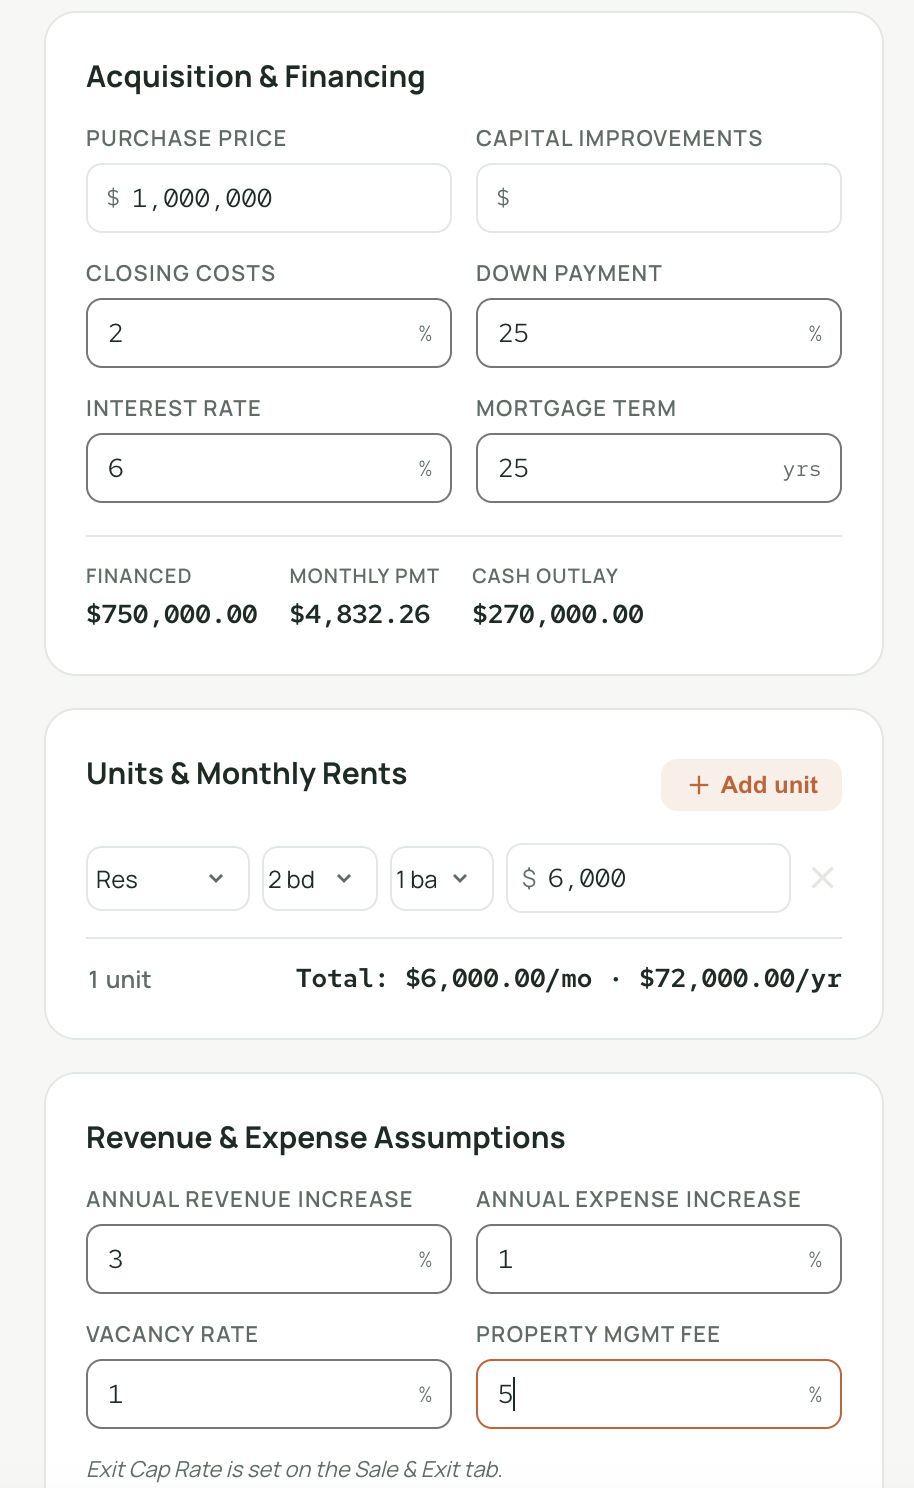
Fox AssetPro deal analyzer input form for rental property analysis
Analysis Results

See the full picture before you commit.

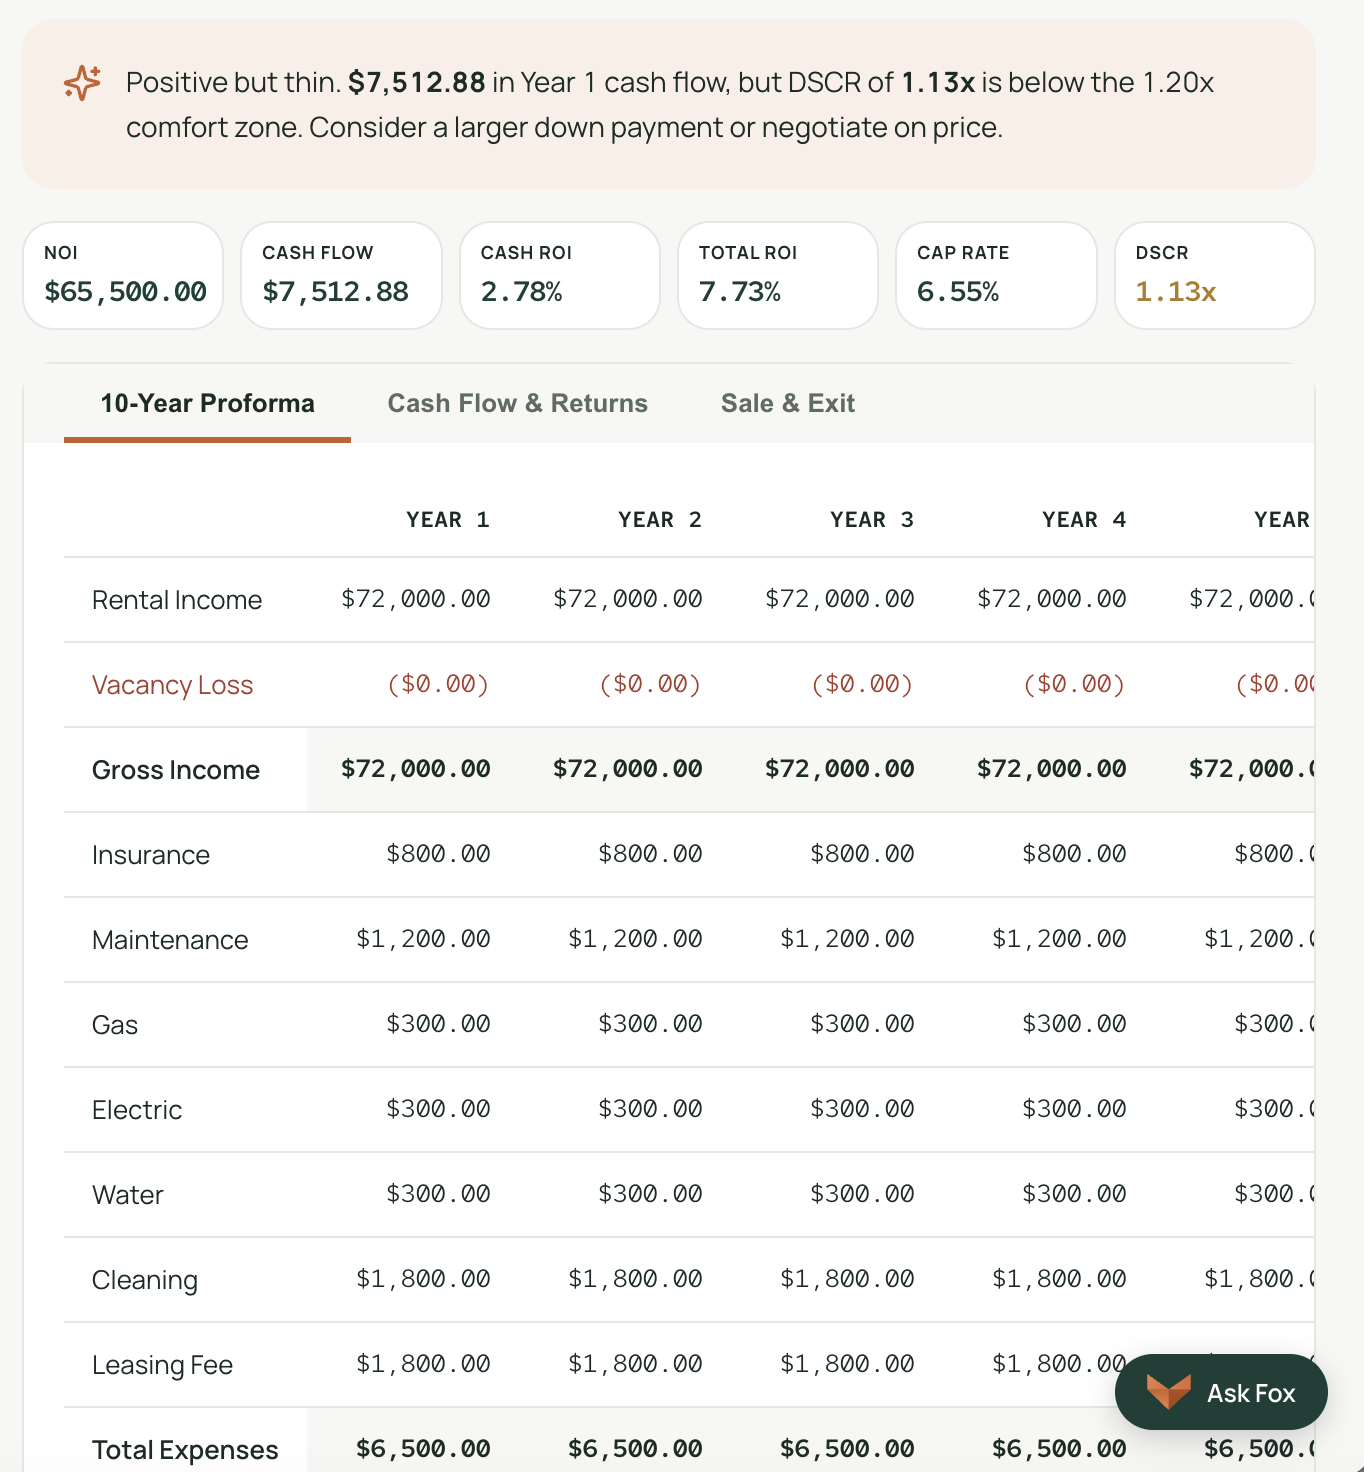
After you enter the deal, Fox AssetPro produces a comprehensive investment analysis that shows you how the property could perform based on the assumptions you enter. The results page presents your key return metrics front and center—NOI, cap rate, cash-on-cash return, DSCR, monthly cash flow and IRR—so you can immediately see whether the deal meets your investment criteria. Every number is connected: change a rent assumption or adjust the interest rate, and every metric recalculates in real time.

Beyond the headline metrics, the analyzer generates a year-by-year pro forma that projects income, expenses, debt service and cash flow over the hold period. You can see how rent growth compounds, how expenses trend, and how mortgage paydown builds equity over time. The pro forma also includes sale and exit analysis—projected net proceeds and IRR at each potential exit year—so you understand not just the cash flow story but the total return story, including when the optimal exit window might be.

This is the difference between a calculator and an analyzer. A calculator gives you one number. Fox gives you the full financial picture—acquisition, operation, financing and exit—in a format you can study, share and revisit before you commit capital to the deal.

Fox AssetPro deal analysis results showing NOI, cap rate, cash flow and IRR
Portfolio Fit

A good deal isn't always a good deal for your portfolio.

Most rental property calculators analyze a property in isolation. They tell you the cap rate, the cash-on-cash return, maybe the IRR—and that is where they stop. But experienced investors know that a property does not exist in a vacuum. A deal that looks strong on its own can weaken your portfolio if it concentrates your risk, stretches your debt position or duplicates exposure you already have. Fox AssetPro is built to evaluate a prospective acquisition in the context of the real estate portfolio you are already building.

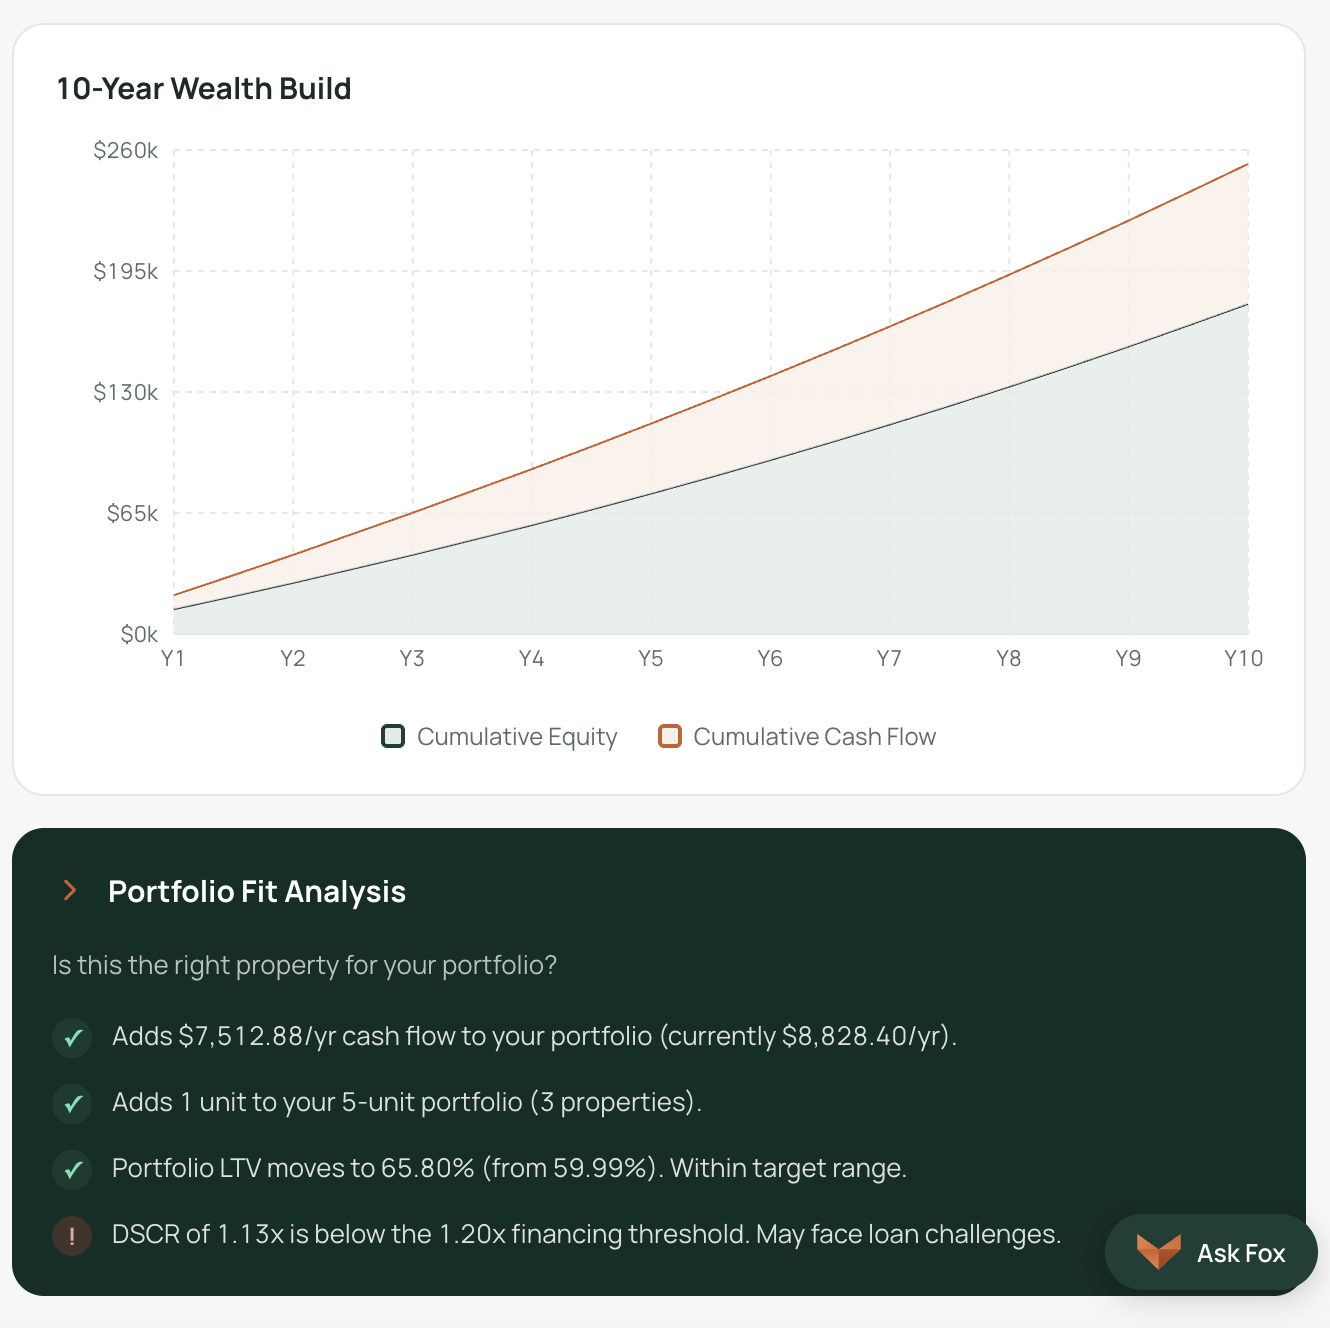
Portfolio Fit Score™ — See how a prospective investment complements the portfolio you already own. When you run a deal through the analyzer, Fox evaluates how that acquisition would change your overall portfolio—and produces a score that tells you whether this property strengthens your position or introduces imbalance. It is the difference between asking "is this a good deal?" and asking "is this the right deal for me?"

The Portfolio Fit Score gives you a layer of intelligence that standalone calculators simply cannot provide. Instead of evaluating every deal in isolation and hoping it all fits together, you get a forward-looking signal that considers what you already own. Two investors looking at the same property can get different scores—because their portfolios are different, and what each investor needs from their next acquisition is different too.

Fox AssetPro Portfolio Fit Score showing how a deal complements your existing portfolio
Save & Compare

Save and compare multiple analyses.

When you are actively looking at deals, you are rarely evaluating just one property. You might run numbers on three different buildings in the same week, or revisit a deal you analyzed months ago when the seller comes back with a lower price. Fox AssetPro lets you save every analysis so you can come back to it later without re-entering a single number. Your deal library grows with you—a running record of every property you have considered, complete with the assumptions and results from the day you analyzed it.

Comparison is where the real clarity comes. When you are deciding between two or three potential acquisitions, you can pull them up side by side and see how they stack up across every metric that matters—cap rate, cash-on-cash return, IRR, cash flow, DSCR and portfolio fit. One deal might have a higher cap rate but weaker cash flow after financing. Another might produce less income today but offer stronger appreciation potential over a ten-year hold. Seeing the numbers next to each other makes the trade-offs visible.

Each saved analysis also includes the full pro forma table—year-by-year projections of income, expenses, debt service, cash flow and equity growth. You can revisit not just the headline metrics but the detailed financial trajectory, compare hold-period returns at different exit years, and share analyses with partners or advisors who need to see the same numbers you are looking at.

SAVED ANALYSES
2258 W. Pilsen Ave
4-unit · Analyzed Sep 12, 2026
Strong Fit
Cap Rate
6.24%
CoC
7.91%
Cash Flow
$1,580/mo
IRR
14.2%
1740 N. Kedzie Ave
6-unit · Analyzed Sep 8, 2026
Moderate Fit
Cap Rate
5.85%
CoC
6.12%
Cash Flow
$1,220/mo
IRR
11.8%
4421 S. Archer Ave
3-unit · Analyzed Aug 29, 2026
Strong Fit
Cap Rate
6.88%
CoC
8.45%
Cash Flow
$1,840/mo
IRR
15.7%

Know the deal before you make the deal.

Analyze potential acquisitions and see how they could fit into the portfolio you're already building.

Get 90 Days Free
90 days free. No credit card required. Then $9/month — locked in for life.
FAQ

Common questions about rental property analysis.

How do you analyze a rental property before buying?

Analyzing a rental property before buying involves modeling the full financial picture of the investment—not just the purchase price. Start by gathering the property's asking price, expected down payment and financing terms. Then estimate gross rental income based on the unit mix and market rents, subtract a vacancy allowance, and list all operating expenses: property taxes, insurance, maintenance, management fees and any utilities the owner pays. The difference between income and expenses gives you Net Operating Income (NOI). From there, layer in debt service to see your actual cash flow, and calculate return metrics like cap rate, cash-on-cash return and DSCR. Fox AssetPro structures this entire process so you enter the inputs once and get a complete analysis instantly, including a multi-year pro forma and exit scenarios.

What numbers should I look at when analyzing a rental property?

The most important metrics for evaluating a rental property investment are Net Operating Income (NOI), which tells you how much the property earns after expenses but before debt service; Cap Rate, which expresses NOI as a percentage of the purchase price so you can compare deals of different sizes; Cash-on-Cash Return, which measures the annual cash flow you actually receive relative to the cash you invested; Debt Service Coverage Ratio (DSCR), which tells you how comfortably the property's income covers its loan payments; and Internal Rate of Return (IRR), which accounts for the timing and magnitude of all cash flows including the eventual sale. No single metric tells the whole story—an experienced investor looks at all of them together to understand whether a deal makes sense from both an income and a total-return perspective.

What is a good cash-on-cash return for a rental property?

Cash-on-cash return measures the annual pre-tax cash flow you receive divided by the total cash you invested (down payment plus closing costs and any renovation). A return of 8% to 12% is generally considered strong for a stabilized rental property, though what counts as "good" depends on your market, property type, risk tolerance and investment goals. In high-appreciation markets, investors sometimes accept lower cash-on-cash returns—5% to 7%—because they expect property value growth to contribute more to total returns. In cash-flow-focused markets, experienced investors often target double digits. The key is to calculate cash-on-cash return using realistic assumptions for rent, vacancy and expenses, not the seller's optimistic pro forma. Fox AssetPro calculates cash-on-cash return automatically from the inputs you provide, so you can adjust assumptions and see how sensitive your return is to changes in rent, vacancy or interest rate.

What's the difference between cap rate and cash-on-cash return?

Cap rate is the property's Net Operating Income divided by the purchase price. It measures the property's unlevered yield—how it performs regardless of how you finance it. A 6% cap rate means the property generates $6 of NOI for every $100 of purchase price. Cash-on-cash return is the annual cash flow after debt service divided by the cash you actually invested (down payment plus closing costs). It measures your levered return—how your actual money performs after financing. The two metrics can tell very different stories. A property with a modest 5.5% cap rate can produce an attractive 9% cash-on-cash return with favorable loan terms, because leverage amplifies returns. Conversely, high-rate financing can turn a strong cap rate into a mediocre cash-on-cash return. Investors use cap rate to compare properties on an apples-to-apples basis regardless of financing, and cash-on-cash return to understand what they will actually earn on the capital they deploy.

How do financing terms affect rental property returns?

Financing terms have an outsized effect on rental property returns because most investors use leverage. The three variables that matter most are interest rate, loan-to-value ratio (LTV) and amortization period. A lower interest rate reduces your monthly debt service, which directly increases cash flow and cash-on-cash return. A higher LTV means you put less cash down—which can amplify your cash-on-cash return if the property's cap rate exceeds the cost of debt, but also increases risk if income falls short. A longer amortization period lowers monthly payments but means you pay more interest over the life of the loan and build equity more slowly. Fox AssetPro lets you model different financing scenarios and see how each variable affects your cash flow, DSCR, cash-on-cash return and IRR. This is especially valuable when you are comparing a conventional 30-year mortgage to a shorter-term commercial loan or an adjustable-rate product.

Can Fox AssetPro compare a new investment to my existing portfolio?

Yes. This is one of the features that sets Fox AssetPro apart from standalone rental property calculators. When you analyze a prospective acquisition, Fox evaluates the deal on its own merits—NOI, cap rate, cash-on-cash return, cash flow, DSCR and IRR—but it also assesses how that property would affect your existing portfolio if you were to add it. The result is a Portfolio Fit Score that tells you whether this particular deal strengthens your overall position or introduces imbalance. Most investors evaluate deals in isolation and hope everything works out at the portfolio level. Fox lets you see the portfolio-level impact before you make the offer, so you can make acquisition decisions that are informed by what you already own.